 Anthony Cecchini is the President of Information Technology Partners (ITP), an SAP consulting company headquartered in Pennsylvania. ITP offers comprehensive planning, resource allocation, implementation, upgrade, and training assistance to companies. Anthony has over 17 years of experience in SAP R/3 business process analysis and SAP systems integration. His areas of expertise include SAP NetWeaver integration; ALE development; RFC, BAPI, IDoc, Dialog, and Web Dynpro development; and customized Workflow development. You can reach him at [email protected].
SAP ABAP Debugger Scripting in NetWeaver 7.0 EHP2
SAP ABAP Debugger Scripting is a new tool added in SAP Netweaver 7.0 EHP2. It is a feature available in the New ABAP Debugger. However, just like some of the other debugger options, you need to check whether the security team has provided access for the debugger script tool.
As ABAP programmers we regularly use Break-Points & Watch-Points for debugging. These are necessary in an ABAP programmers role to find the bugs in custom developments, analyze the Standard SAP program or find a BADi for that matter. So where does this Debugger scripting come into play? What is Script Debugging Used for?
Designed To Make Debugging ABAP Code Easy
The debugger scripting is a tool is designed to make debugging easy. Sometimes debugging can be very tiresome, especially when debugging SAP standard code is involved. See my previous blog on Layer Aware Debugging (SLAD) in SAP Demystified for another great tool to speed up debugging time.
The debugger scripting tool can sometimes come to the rescue, as it helps automate the process of debugging.
Some of the benefits of Debugger Scripting are:
he new scripting capability lets you automate anything that you can do by hand in the New ABAP Debugger. Debugger Scripts also make some things possible – like all kinds of tracing – that aren’t possible by hand.
With ABAP Debugger Scripts, you can:
– Analyze and modify the contents of variables and objects in the program you are debugging.You can display or change the value of a variable by hand in the debugger, and you can do the same thing with a script. The classical example: You can skip over failed AUTHORITY-CHECK statements with a script by stopping at each AUTHORITY-CHECK, running it, and resetting SY-SUBRC to 0. (This is still recorded in the System Log….)
– Perform any imaginable tracing that you might want to do.
With scripts, you can…..
– Do the first automated absolutely complete trace of executed ABAP statements possible (SAT – the new ABAP Runtime Analysis – cannot capture every executed statement.
– Trace the call stack in an ABAP application or in any part of an application – very useful if you want to find out what to include in a profile for ABAP Layer-Aware Debugging (See Layer Aware Debugging (SLAD) in SAP Demystified.)
– Define your own traces with any trace message content that you can imagine. You can for example trace the value of a parameter that is passed up or down the call stack in your application to find out where it goes bad.
– Implement your own breakpoints and watchpoints, should the extended set introduced in EHP2 not meet your needs. You can combine the powers of the new ABAP breakpoints and watchpoints with the intelligence of scripts. Some system in your landscape is returning trash in an RFC data structure? No problem. Have your script run whenever the program in the debugger does an RFC (breakpoint at RFC), execute the RFC call, check the returned data in your script, write a trace or break execution when you find the bad data return.
– Analyze and display data from complex data structures (internal tables with nested objects, for example) The revised Table tool in the New ABAP Debugger makes it a lot easier to look at data in a complex data structure (look for the upcoming weblog). But for tracing data generation or checking data consistency as your debuggee runs, a script is the better tool. The classical example is an internal table with nested objects whose attributes you want to check. A script can read those nested attributes row by row, check or trace them as you wish, and even stop execution if something goes wrong.
– Program (interactive) tools for standard tasks, such as checking data consistency, changing variable values to test error handling, and so on.
A lot of script programming is quick ad hoc work right in the debugger to help you with some analytical or data collection problem.
But ABAP Debugger Scripting also lets you save scripts for re-use. And Transaction SAS offers a comfortable workplace for developing scripts away from the pressure of an active debugging session. You can develop tools or utilities for debugging to suit your special needs, and you can share these scripts with others on the same or on other ABAP Systems.
Debugger Scripting – A Closer Look
In the new ABAP debugger there is a separate TAB “Script” after the TAB “Diff”(Diff-Tool).
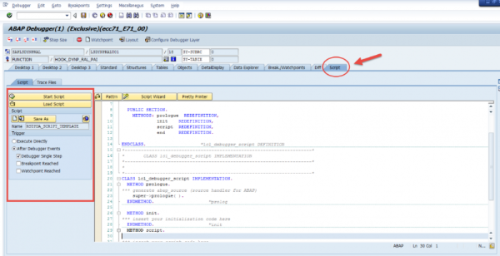
In this TAB, are various options for creating and executing an ABAP script. Let take a closer look….
There is a standard create button, to create a new script. Each new script that is created has four methods that can be implemented. These methods are triggered at specific events. Most importantly this code is generated automatically whenever a script is created so no coding!
A local class “LCL_DEBUGGER_SCRIPT” is implemented, which has the follwing method defintions:
Method PROLOGUE
After the script is started, the Debugger framework first calls the PROLOGUE method of the script. The default implementation registers the ABAP_SOURCE instance to the DEBUG_STEP event so that the source code information you get from the ABAP_SOURCE instance is always up-to-date.
Method INIT
INIT method is called only once, directly after the PROLOGUE method. You use this method for initialization. It is also a place to add user interaction, for example, a dialog box, where you ask the user for input, which you may need for the script.
Method SCRIPT
SCRIPT method is where we write the Object Oriented ABAP code that executes. This method is called each time the debugger script executes. It has an importing parameter p_trigger, which holds the trigger type that caused this script to execute (Breakpoint, Watchpoint, Single Step, Single Run).
Method END
When the script stops, END method is called.
Besides these custom methods, the Script Super class also includes two already implemented methods :
BREAK – This returns the control to the user. You can stop the script or continue here.
RAISE_ERROR – This method is used to exit a script, with respective message displayed to the user.
Like the standard ABAP Editor, in Debugging Script Tool also there are buttons for syntax check, include patterns & pretty printer. There is also a button for the Script Wizard, that can used to generate the code automatically so that the programmer doesn’t have to write the entire code, you can just modify the generated code, based on your specific requirement.
The triggering of debugger script can be done in a number of ways.
– It can be Triggered directly.
– It can be triggered when a Breakpoint is encountered while executing the code.
– It can be triggered when a Watchpoint is encountered while executing the code.
– It can be triggered after each debugger step
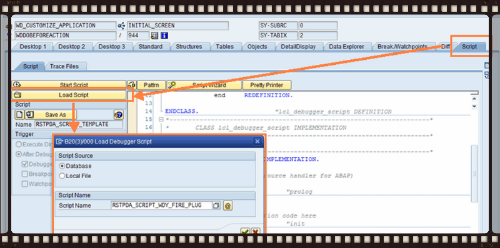
Since the debugger script is a local Object Oriented program that is executed in the new ABAP debugger, it can be easily saved for later use and loaded whenever required. Which removes the hassle of doing same things again and again as in a normal debugger.
As tracing is a strong component of this tool, a button is specifically provided on the screen to display a trace. This inherently triggers a Transaction code SAS, used for viewing a debugger trace.
Well thats the bare bones to get you started. if you are like me you are already thinking up ways to use thsi tool. Custom watch-points, custom error logging,..etc
But to help you get some immediate patcitcal use from this tool I have included some links below.
First the SAP Help on Script Debugging.
Next a short video on ABAP Debugger Scripting: Basics…
Finally, here are few REALLY excellent exmaples of practical uses for ABAP Script Debugging.
Tracing a Program with the ABAP Debugger Script
How to Create a Watchpoint for a Field Symbol in the ABAP Debugger
Skip the Authority Check with the ABAP Debugger Script
In Summary
The debugger scripting tool is quite a new tool for most ABAP Developer and it becomes very handy once you get the hang of it. It requires the knowledge of Object Oriented ABAP as a prerequisite, which in itself is something all ABAP programmers should learn. It can make your a little bit easier when faced with a difficult bug to solve, so give the tool a try!