Anthony Cecchini is the President of Information Technology Partners (ITP), an SAP consulting company headquartered in Pennsylvania, with offices in Vienna, VA. ITP offers comprehensive planning, resource allocation, implementation, upgrade, and training assistance to companies. Anthony has over 20 years of experience in SAP business process analysis and SAP systems integration. His areas of expertise include SAP NetWeaver integration; ALE development; RFC, BAPI, IDoc, Dialog, and Web Dynpro development; and customized Workflow development. You can reach him at [email protected].
Now that you know the basics of creating an Qlik Sense Desktop App from scratch, which we learned from Part#1 of this blog series, let’s make a new Qlik Sense App from a data file. For this demo, you can download the Qlik sample data (gettingstarteddata.xls) from Qlik here.
Building a Qlik Sense App from Excel Data
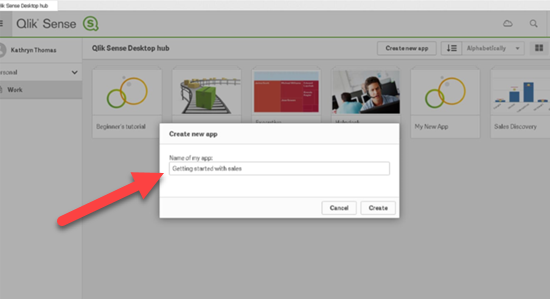
First, lets create a New Qlik Sense App and name it “Getting Started with Sales”.
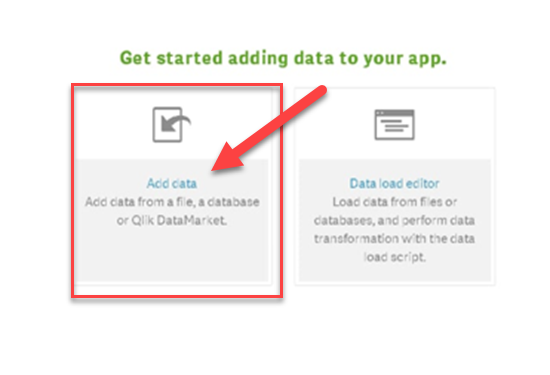
The next step is to connect to the data you want to use for your Qlik app. You can choose from any data file on your computer or your network including Microsoft Excel, Microsoft SQL, MySQL, ODBC, SAP HANA, Oracle, and web files. Or you can link to one of the data files in the Qlik Data Market. This time we will add data from a file rather than the Qlik Market.
The sample data is in the Excel file you downloaded, but please note that you have many options. lets drag and drop the Excel file into Qlik. (You can also navigate to the file through Qlik).

Qlik Sense Desktop recognizes the Excel file automatically. By default, Qlik chooses all the columns in the data file. However, you can override this and choose only the ones you want by clicking on the orange checkbox at the top of each column.
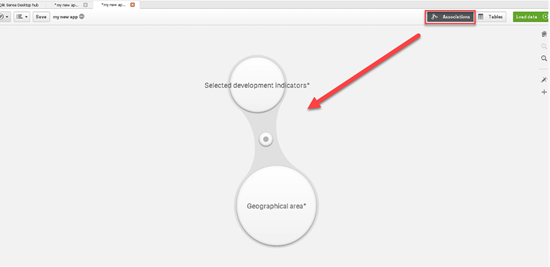
For this demo, we will load all the column fields. Click on “Add Data” and Qlik will upload the data. Click the “Load Data” button to get to the Qlik Association or Table View. Remember the Qlik association and table view is where you can add additional files and set links between tables. For now, close the window, and you will be back at the Qlik Hub.
Using Qlik Data Visualizations
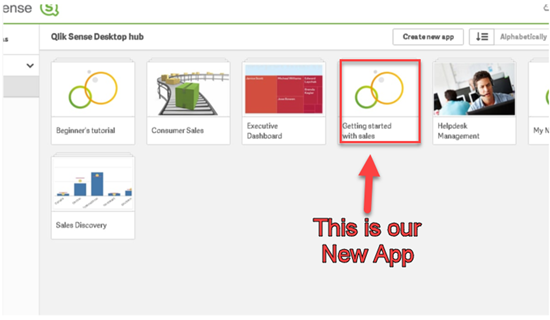
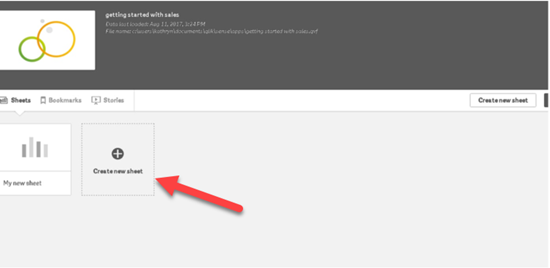
Now we will create some Qlik visualizations. Open the “Getting started with sales” app by double-clicking. This will bring you to the Qlik Sheet Management page. Sheets are blank templates in Qlik that serve as the background for your charts, graphs, and other visualizations.
Click on “Create New Sheet” to get started.
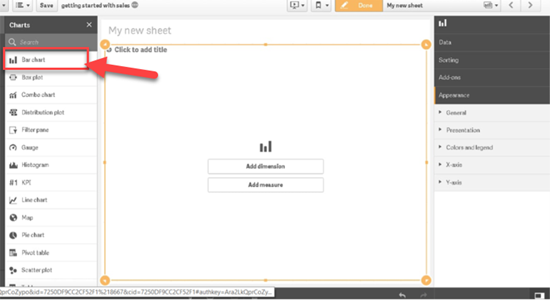
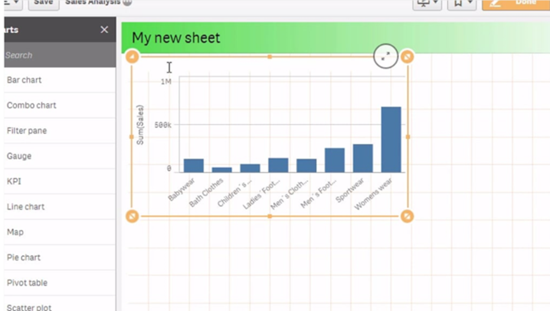
This will open up a blank template. We’ll start with creating a Bar Chart. Click on Edit, then choose Bar Chart from the left-hand menu.
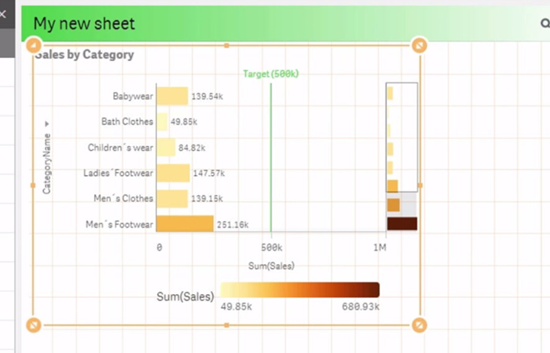
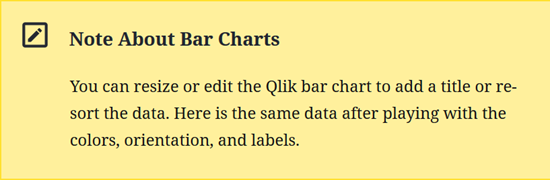
Qlik gives you several appearance options. You can change titles, labels, colors, and customize the legend. We’ll keep ours simple, but you can customize your bar chart to fit your needs. Use the Dimension for who, what, or when and Measure for how you want to measure the dimension. For this demo, we will use Category Name and Sales (Dollars) columns from the uploaded sales data.
Summary
We Created an app and loaded the data from an Excel file. We created Qlik data sheets with Bar Charts to customize the interaction the app. Bar Charts are just one of the many visualizations available. You can make pie charts, distribution plots, line charts, and more following the same steps. This is where the power and flexibility of Qlik start to shine. All the data objects are drag and drop allowing the user to create visualizations by selecting data objects, then drilling down to examine associations for guided analytics.
QlikSense offers a free Qlikview download to their desktop and cloud versions. Qlik provides an extensive Qlik knowledge base, YouTube Qlik Sense training videos, and a Qlik Resource Library with tutorials and on-demand webinars.